
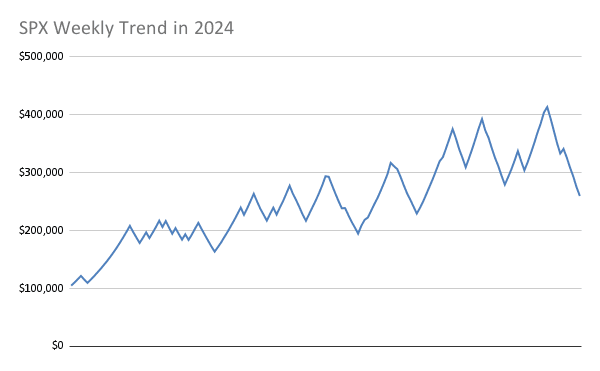
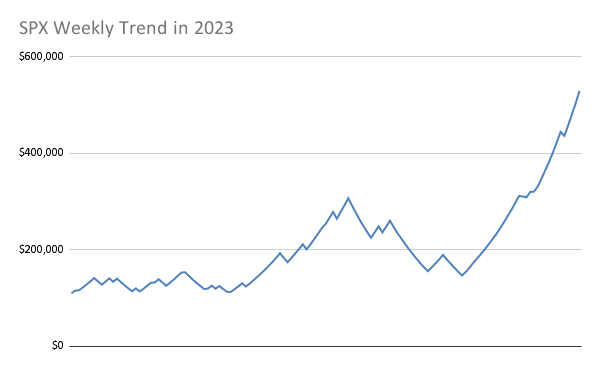


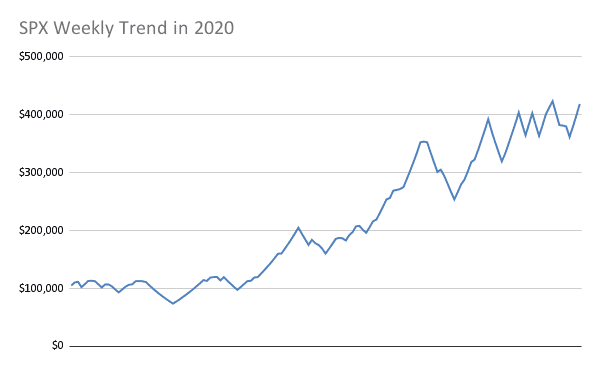
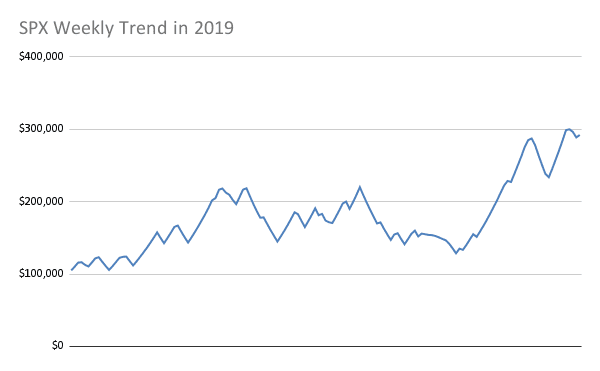
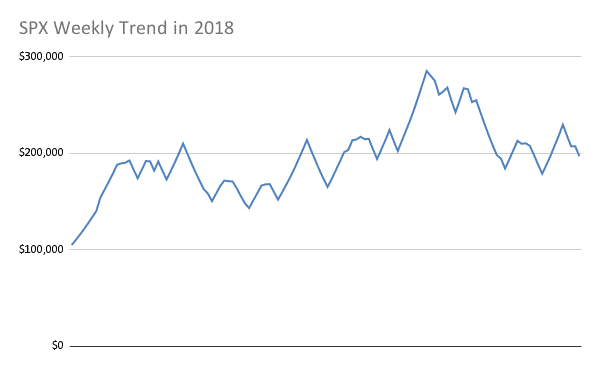

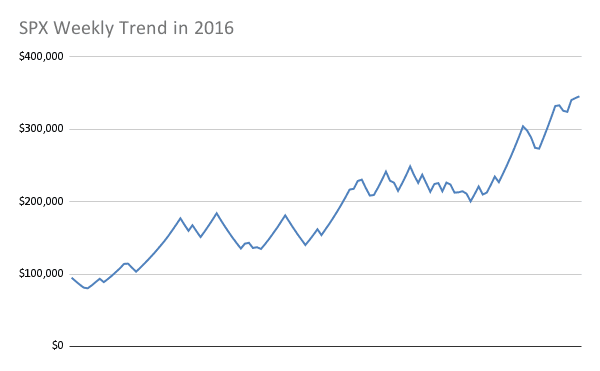
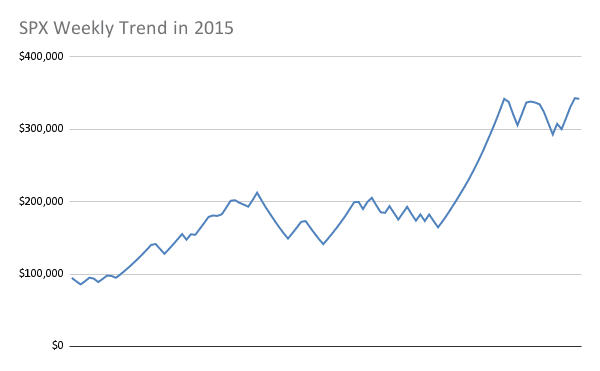
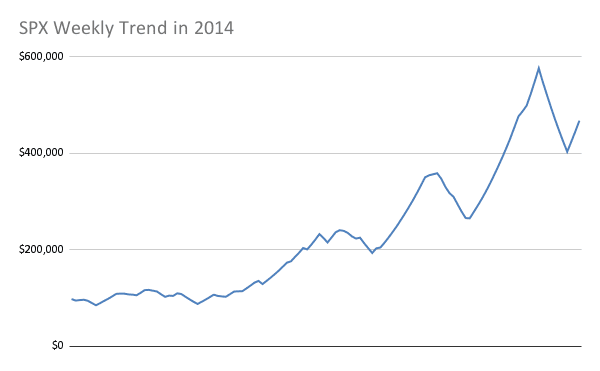

Over a decade of performance across market cycles. The following equity curves illustrate the compounding growth potential of our Weekly Trend strategy, modeled on a $100,000 account. While there are occasional drawdowns and periods of consolidation, the strategy is designed for a consistent edge in SPX weekly options trading. Full trade logs are shown on the Weekly Trend page.
Past performance is not indicative of future results. All performance data is based on trades using open and close prices from the Weekly Trend service. Results do not account for slippage or commissions and are presented for illustrative purposes only.