

Steady Monthly Growth —
Steady Monthly Growth
One Low-Risk SPX Trade per Month
Get one strategic SPX bull put spread per month — fully automated, defined-risk, and stress-free.
51.07% Avg Annual Return · ~55% Win Rate · Defined 1:2 Risk/Reward
Performance You Can Trust
Real performance since 2013 — 54% average annual returns from live trades, not backtests.
Peace of Mind Trading
One low-risk trade a month, keeping things simple and protecting your capital.
Steady Through Every Market
Designed to deliver stability, so your account grows steadily—even when markets get rough.
Why This Strategy Works
Bull Put Spread Strategy Methodology

The Monthly Trend strategy follows a simple idea: the S&P 500 tends to move higher over time.
That’s why we place just one smart trade each month, targeting steady, low-stress growth.
We keep risk small by using only 5% of your account per month. Additionally, we structure each trade so that when we’re right, we earn about twice as much as we risk. Historically, we’ve gotten it right about ~55% of the time.
This straightforward approach helps you avoid panic moves and overtrading. In fact, since 2013, we’ve seen only three consecutive losing months—highlighting how consistently the strategy performs.
- Follows the Market’s Long-Term Growth – No guessing or day-trading.
- One Trade a Month – Easy to manage. Just one simple action.
- Around 30 Days Per Trade – Plenty of time for the trade to work.
- Auto or Manual – You decide whether to let the system trade or place it yourself.
This podcast episode explains how the Monthly Trend bull put spread strategy works—one trade per month, built for stress-free trading with confidence.
2026 Performance Overview
The results below show real trades from our SPX auto-trading system. Every month, we carefully manage risk—never using more than 5% of the account at one time. The performance is based on a $100,000 starting balance and grows month by month.
We keep everything fully transparent. Each trade is tracked using real market prices you can look up yourself. A trade is counted as successful if the price at the end of the day is higher than when it was entered.
Even though markets can go up and down in the short term, our goal stays the same: steady growth. Over the past 12 years, our track record shows reliable results in many different market conditions.
The results below show real trades from our SPX auto-trading system. Every month, we carefully manage risk—never using more than 5% of the account at one time. The performance is based on a $100,000 starting balance and grows month by month.
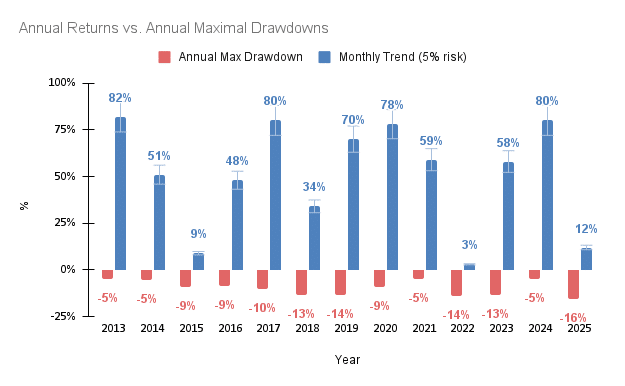
Historical Performance
Since 2013, Monthly Trend has averaged a 51.07 yearly return – with fewer losses and smaller dips compared to the S&P 500.
Even in tough years, our strategy stayed strong and performed better than the market. The chart shows how Monthly Trend (with only 5% risk) outperformed the S&P 500 (with 100% risk) year after year.

What you get with Monthly Trend
✔ Email trade alerts
✔ One structured trade per month
✔ Defined $1 risk to target $2 framework
✔ Position sizing guidance
✔ Low-maintenance strategy
✔ Rules-based, data-driven execution
✔ Optional automation support
What you get with Monthly Trend
- Trade alerts via email
Entry and exit alerts for SPX trades. One signal per month
Risk $1 to target $2 with this rules-based framework. A position is opened every first Monday of the month, with the first 30 minutes of market open.Clear position sizing guidance
Allocation recommendations so you can choose an allocation based on your comfort level.Low Maintenance
Simply place one trade monthly, spend less time on screens, pay fewer fees, and avoid day-trading stress.Rules-based, data-driven execution
Signals follow a systematic process built on extensive historical market data, not discretion.Optional automation support
If you choose to automate, we help you set it up so trades follow the same rules, entries, and exits shown in our verified track record, using limit orders.
- Trade alerts via email
Monthly Trend Signals
- Email trade alerts for SPX
- One structured signal per month
- Defined-risk 1:2 bull put spread
- Allocation guidance included
$149
/month
🔒 Signals via email. Automation optional. You stay in control.
Cancel anytime. No questions asked.
Who Monthly Trend Is Built For
This isn’t for thrill-seekers or day-traders. This Monthly Trend bull put spread strategy is for smart investors who want steady growth without taking big risks.
- Time-Constrained Professionals
You’ve got a demanding job, and that’s why this strategy works quietly in the background. It steadily grows your money without requiring any of your time.
- Retirees & Near-Retirees
You care about your savings, so Monthly Trend helps you grow income confidently and enjoy peace of mind.
- Cautious Investors
You want a clear plan, not wild swings. That’s why we limit risk and follow proven rules every step of the way.
- New to Options or Trading?
No worries—you’re in the perfect place to start. You’ll place just one simple trade each month, so there’s no guessing and no overwhelm.
What Our Clients Are Saying
The most compelling evidence about our bull put spread strategy is derived from traders like yourself who are achieving real results.
“Simple, calm, and well-structured. Exactly how investing should feel.”
— Philip M.
Verified subscriber · Using Monthly Trend for 5 months
“I was nervous about options at first, but the defined risk and clear guidance makes this very easy to follow.”
— Hayder H.
Verified subscriber · Using Monthly Trend for 4 months
“I’ve tried more active strategies before, but they required too much attention. Monthly trend fits my life better. Only one trade per month with a conservative approach I’m comfortable with.”
— Joseph A.
Verified subscriber · Using Monthly Trend for 1+ year
“My priority is protecting capital. I appreciate that risk is just 5% and decisions are made systematically, not emotionally.”
— William H.
Verified subscriber · Using Monthly Trend for 9 months
“I’ve been investing for years, and this strategy feels mature and thoughtful. It’s really designed for consistency, not excitement. Thank you, guys.”
— Dave M.
Verified subscriber · Using Monthly Trend for 1 year
Transparent. Verified. Proven.
Get the 2024 Verified Brokerage Statement for Monthly Trend
Want proof it actually works? Download our real Interactive Brokers statement for Monthly Trend. You’ll see the exact trades, profits, and dates from 2024 — directly from our live trading account.
- Verified by a third party — not a simulation
- All trades documented — real entries and exits
- Backed by real money — not theory
Whether you’re just starting out or managing serious capital, this is your chance to see the system in full transparency — no guesswork, no filters.
Enter your email to get instant access:
Return Calculator
See what Monthly Trend can do for you. If you start with:
- [$5,000 slider]"
- [Number of years dropdown]"
- [Risk setting toggle: 5% / 10%]
- "Your projected result: $XX,XXX"
FAQs
Everything you need to know about out Monthly Trend bull put spread strategy before getting started.
Is this strategy risky?
Every investment carries some risk. However, this strategy keeps it small and under control from the very beginning.
We risk only 5% of your account per trade. As a result, the most you could lose in a month is just that 5%—even in a worst-case scenario. You never face unlimited losses.
We avoid trading naked options altogether, since these risky trades can blow up entire accounts. Instead, we always use defined-risk strategies like bull put spreads, so you know your maximum potential profit and loss up front.
Ultimately, our goal is simple: grow your account steadily while shielding you from major drawdowns.
How much should I allocate?
To begin confidently, start by risking just 5% of your account on each trade.
For example, when you trade a $100,000 account, you risk $5,000 per trade. A winning trade can earn around $10,000, while a losing trade will cost you $5,000.
However, if you feel comfortable taking on more risk, you can increase your allocation to 7.5% or even 10%. Historically, trading with 5% risk has delivered about 54% yearly returns, while 10% risk has produced over 100% per year.
Additionally, when you reinvest your profits, you can enable an automated feature that adjusts your trade size as your account grows—available through brokers such as Global AutoTrading or AutoShares.
What was the maximum number of losers in a row?
In the last twelve years, our strategy has shown remarkable consistency, with no more than 3 consecutive losing trades in any single year.
Should I scale in?
Yes — many of our users start small and grow steadily over time. To begin, we recommend using just 5% of your account per trade. This way, you keep risk low while you build trust in the system.
Later on, once you feel comfortable and confident, you can gradually increase your position size up to 10%. As a result, this flexible strategy ensures you always stay in control.
Why does the S&P500 always go higher?
The S&P 500 tends to rise over time for a few simple reasons. In fact, you’ll see this pattern play out again and again:
-
The economy grows – As companies earn more money, they drive stock prices higher.
-
The world invests in the U.S. – Global investors constantly see U.S. markets as stable, so they put their money here.
-
Investor optimism – Time after time, stocks rise because people expect companies to perform well.
-
Companies reinvest profits – Many firms actively buy back their own shares and reinvest earnings, which steadily boosts prices.
-
Weeding out the weak – The S&P 500 regularly replaces underperforming companies with stronger ones, so the index stays packed with top performers.
-
ETF inflows – Every month, billions flow automatically into index ETFs, which consistently pushes prices higher over time.
What is SPX?
SPX stands for the S&P 500 Index, which tracks the performance of 500 of the largest U.S. companies, including Apple, Microsoft, and Google. Instead of buying individual stocks, we trade options that move with the value of the entire index. This approach allows us to focus on broader market trends rather than single companies.
Unlike stocks, SPX options settle in cash, so you never actually own any shares. Instead, you receive profits or cover losses in cash when the trade closes. As a result, many experienced traders use SPX options to manage risk and aim for steady returns. That’s exactly why we rely on them in the Monthly Trend bull put spread strategy.
What is a bull put spread?
A bull put spread is a low-risk options strategy that we actively use to generate steady income whenever we expect the market to stay flat or move slightly higher.
Here’s how it works in simple terms:
First, you sell one option and simultaneously buy another at a lower price. Both options are based on the same stock index, such as the SPX, and share the same expiration date. This setup creates a spread that clearly defines your potential reward and limits your risk upfront.
When the market stays above a certain level by the end of the month, you lock in a profit. On the other hand, if it drops too far, your losses remain capped. This way, you always know the worst-case outcome before you ever enter the trade.
Overall, many professionals favor this strategy because it combines controlled risk with predictable returns. That’s exactly why we rely on it in Monthly Trend.
Does your table show real trades?
Yes, all trades shown in our performance tables are real executed trades—not hypothetical simulations.
While brokerage commissions aren’t explicitly included, they are typically minimal. This is because our monthly bull put spread strategy involves only one trade per month.
How many trades do you have open at the same time?
Just one. We keep it simple and focused. One trade per month means less stress and less risk. It also lets you keep funds available for other strategies or emergencies.
Can I trade Monthly Trend with my cash account?
Yes! You don’t need margin. The strategy is fully covered by the cash in your account, so it’s perfect for traders who want to avoid borrowing or using leverage.
Is there a risk that I will be assigned?
No. We use SPX options, which settle in cash — not stock. That means you won’t have shares assigned to you. You’ll simply see a gain or loss in your account at expiration.
Can I trade Monthly Trend in my IRA account?
Yes, as long as your broker allows credit spreads in IRAs. Most do — including Interactive Brokers and Tradier. Just double-check that your account is approved for this type of trade.
