How It Works
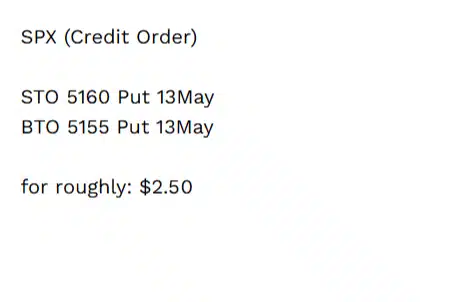
In this trade, we sell (STO- Sell to open) a put and buy (BTO- Buy to open) a lower-strike put to create a defined-risk credit spread with a 1:1 risk-to-reward structure at entry.
Risk & payoff at entry: We collect $2.50 in premium with a maximum possible loss of $5.00 if held to expiration.
- Winner: SPX closes above 5,160 on May 13 (expiration)
- Partial result: SPX closes between 5,160 and 5,155
- Full loss: SPX closes below 5,155
Trade outcomes are determined using the official SPX closing price, which is publicly available and independently verifiable.
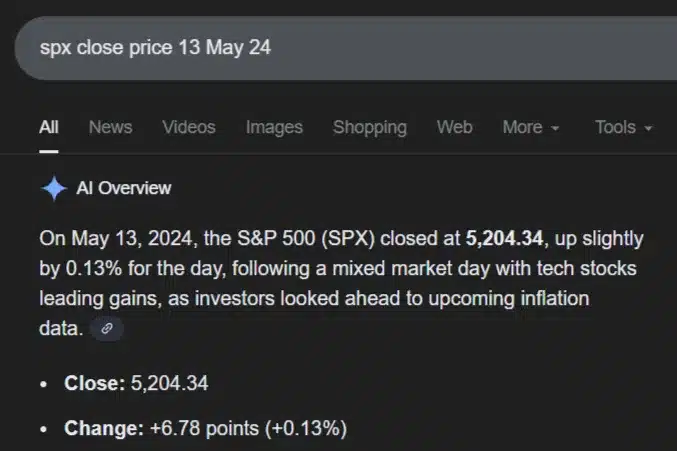
This public SPX closing price is used to determine whether the trade closed as a winner or loser at expiration.
We intentionally reference independent, public market data so you can verify results without relying on internal reports.
- Source: Google / public market data
- Instrument: S&P 500 Index (SPX)
- Used for: Final trade outcome verification