
High-Yield Options Trading
Get up to 5 fully automated SPX/SPY trades per week, backed by 12+ years of verified performance — no guessing, no screen time, no stress.
Get up to 5 credit spread trades per week, backed by 12+ years of verified results.
246.23% Avg Annual Return · -60% Win Rate · Defined 1:1 Risk/Reward
Proven Results You Can Trust
12 years of real trades with a -60% win rate and 1:1 risk-to-reward. Not theory—just results.
No Chasing. No Stress.
Relax as up to 5 trades a week grow your account steadily—no panic or overtrading.
Protect Your Capital, Sleep at Night
Allocate 1%–5% per trade based on your comfort level, helping you avoid large losses.
Why This Strategy Works
Credit Spread Strategy Methodology

Every Monday, within the first 15 minutes after market open, we share one credit spread on SPY or SPX.
Each trade is entered with a predefined 1:1 risk-to-reward, with risk fully defined at entry. No stop-loss is used.
If the market moves higher Tuesday–Friday, additional positions will be added.
All positions expire the following Monday.
If the market moves lower after Monday, no additional exposure is added.
The strategy is designed to benefit from the long-term upward bias of the S&P 500 and to reduce activity during downtrends.
In prolonged bear markets, trading may be reduced or paused.
Manual traders can decide at market open whether to take the trade.
Monday Morning
We open one SPX or SPY credit spread within 15 minutes of market open.
Defined Risk
Each trade uses a 1:1 risk-to-reward structure with risk fully defined.
If Market Moves Higher
Additional positions may be added Tuesday–Friday.
If Market Moves Lower
No additional exposure is added.
Expiration
All positions expire the following Monday.
How It Works
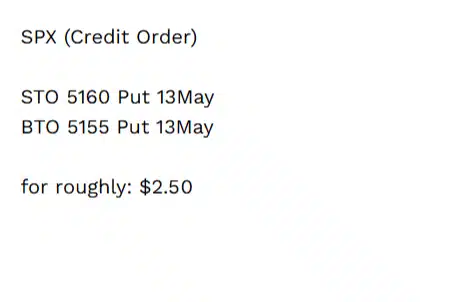
In this trade, we sell (STO- Sell to open) a put and buy (BTO- Buy to open) a lower-strike put to create a defined-risk credit spread with a 1:1 risk-to-reward structure at entry.
Risk & payoff at entry: We collect $2.50 in premium with a maximum possible loss of $5.00 if held to expiration.
- Winner: SPX closes above 5,160 on May 13 (expiration)
- Partial result: SPX closes between 5,160 and 5,155
- Full loss: SPX closes below 5,155
Trade outcomes are determined using the official SPX closing price, which is publicly available and independently verifiable.
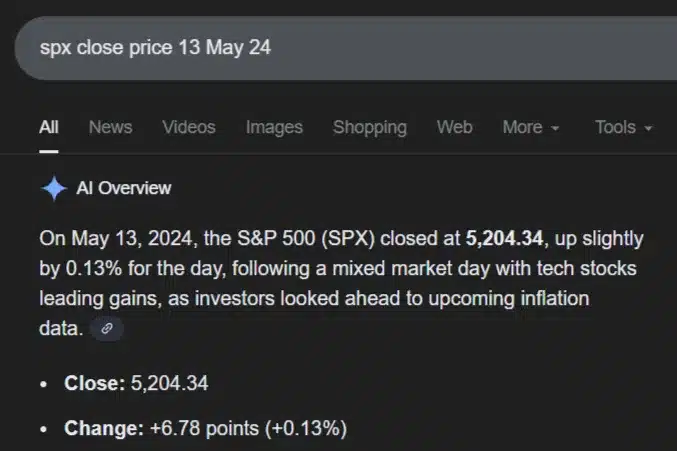
This public SPX closing price is used to determine whether the trade closed as a winner or loser at expiration.
We intentionally reference independent, public market data so you can verify results without relying on internal reports.
- Source: Google / public market data
- Instrument: S&P 500 Index (SPX)
- Used for: Final trade outcome verification
2026 Performance Overview
We track real-time SPY and SPX trades with a disciplined 5% risk per position. Results come from actual fills, compounded from a $100,000 SPX and a $10,000 SPY account.
For full transparency, we include SPX open and close prices so you can verify every trade. A trade is a win if the exit beats the entry price; otherwise, it’s a loss.
While short-term swings are normal, we stay focused on long-term capital growth through disciplined, risk-controlled execution. Over 12 years, this credit spread strategy has delivered consistent, verified performance.
✔ Real SPX/SPY trades
✔ 5% risk per trade
✔ Fully verifiable results
Results come from actual fills compounded from:
$100k SPX account
$10k SPY account
Historical SPX Performance Overview
All results below are based on a defined-risk credit spread strategy
using a 1:1 risk-to-reward ratio and a maximum risk of 5% per trade.
Each trade is evaluated using published SPX open and close prices, so results can be independently verified. View detailed trade logs by clicking on ROI.
| Year | ROI | Total Trades | Winners | Losers | Win Rate | Max Losers in a Row |
|---|---|---|---|---|---|---|
| 2025 | 82% | 166 | 92 | 74 | 55% | 7 |
| 2024 | 159% | 157 | 90 | 67 | 57% | 8 |
| 2023 | 429% | 136 | 91 | 45 | 65% | 10 |
| 2022 | 76% | 84 | 43 | 41 | 51% | 5 |
| 2021 | 325% | 140 | 86 | 54 | 61% | 8 |
| 2020 | 318% | 141 | 95 | 56 | 61% | 10 |
| 2019 | 192% | 151 | 88 | 63 | 58% | 10 |
| 2018 | 97% | 124 | 70 | 54 | 57% | 7 |
| 2017 | 243% | 151 | 91 | 60 | 60% | 8 |
| 2016 | 136% | 127 | 79 | 48 | 61% | 6 |
| 2015 | 242% | 116 | 69 | 47 | 58% | 7 |
| 2014 | 367% | 126 | 79 | 47 | 63% | 8 |
| 2013 | 535% | 124 | 89 | 35 | 71% | 6 |
| — | — | — | — | — | 60% Avg Win Rate | — |
Risk & Performance Disclosure:
Returns vary based on account size, risk per trade, position sizing, and brokerage
commissions. The results shown assume a maximum risk of 5% per trade.
In an extreme losing streak, this could result in a peak-to-trough drawdown
of up to ~50%. Traders who choose to risk 2.5% per trade would
expect approximately half the return and half the drawdown.
Example: In 2023, reducing risk from 5% to 2.5% per trade would have resulted in an
estimated ~150–200% annual return with a
~20–25% maximum drawdown, assuming identical trade execution.
Past performance is not a guarantee of future results.
| Year | ROI | Total Trades | Win Rate |
|---|---|---|---|
| 2025 | 82% | 166 | 55% |
| 2024 | 159% | 157 | 57% |
| 2023 | 429% | 136 | 65% |
| 2022 | 76% | 84 | 51% |
| 2021 | 325% | 140 | 61% |
| 2020 | 318% | 141 | 61% |
| 2019 | 192% | 151 | 58% |
| 2018 | 97% | 124 | 57% |
| 2017 | 243% | 151 | 60% |
| 2016 | 136% | 127 | 61% |
| 2015 | 242% | 116 | 58% |
| 2014 | 367% | 126 | 63% |
| 2013 | 535% | 124 | 71% |
| — | — | — |
60% Avg Win Rate |
What you get with Weekly Trend
✔ SPX & SPY trade alerts
✔ Structured weekly signals
✔ Defined-risk credit spreads
✔ Position sizing guidance
✔ Optional automation support
What you get with Weekly Trend
- Trade alerts via email
Entry alerts for SPX and SPY within the first 15 minutes of market open, with exits provided for SPY trades. Multiple signals per week
A core position is typically opened on Monday, with additional alerts during the week when conditions allow.Defined-risk credit spread strategy
Every trade uses a fixed 1:1 risk-to-reward, defined upfront at entry.Clear position sizing guidance
Allocation recommendations so you can choose an allocation based on your comfort level.Rules-based, data-driven execution
Signals follow a systematic process built on extensive historical market data, not discretion.Optional automation support
If you choose to automate, we help you set it up so trades follow the same rules, entries, and exits shown in our verified track record, using limit orders.
- Trade alerts via email
Weekly Trend Signals
- Email trade alerts for SPX & SPY
- Multiple structured signals per week
- Defined-risk 1:1 credit spreads
- Allocation guidance included
🔒 Signals via email. Automation optional. You stay in control.
$149
/month
Cancel anytime. No questions asked.
Understand the Weekly Trend Strategy — Before You Commit
A 15-minute explainer video of how our SPX/SPY credit spread system works — including entry rules, risk limits, and what to realistically expect week to week.
- Strategy Mechanics Explained – Learn the logic behind our credit spread approach — before deciding if it’s right for you.
- Risk & Capital Management Overview – See how trades are structured to prioritize consistency and capital preservation.
- Time & Involvement Expectations – Understand what’s automated, what isn’t, and how much oversight is required.
Most viewers use this video to decide whether Weekly Trend fits their goals — before opening an account.
Enter your email to watch the full walkthrough:
Verified performance. Trusted by 500+ traders.
Who Weekly Trend Is For
This credit spread strategy is designed for time-constrained professionals and high-growth investors who want high market participation through automation — with minimal time commitment.
- Time-Constrained Professionals
Designed for investors who value clear rules, verified data, and repeatable execution — without watching markets all day.
- High-Yield Seekers
For growth-oriented investors who prioritize return potential, accept short-term drawdowns, and want asymmetric upside.
- Manual Swing Traders
Ideal if you already trade options but want a systematic framework to reduce overtrading and second-guessing.
What Our Clients Are Saying
The most compelling evidence about our credit spread strategy is derived from traders like yourself who are achieving real results.
“It is every bit what their web site says it. And their support line is very responsive.”
— Wayne S.
Verified subscriber · Using Weekly Trend for 5+ months
“I have been investing for over thirty years. My results have exceeded my expectations by far.”
— Todd M.
Verified subscriber · Using Weekly Trend for 1+ year
“With weekly trend there is a clear plan and no last-minute decisions. That’s a big upgrade from how I traded before. Thank you Advanced Auto trades.”
— Liam J.
Verified subscriber · Using Weekly Trend for several months
Automation was the main reason I signed up. It does what it’s supposed to do and I get the same fills published.”
— Rob T.
Verified subscriber · Using Weekly Trend for 3-6 months
“I have been in this service for about 11 months now. I have made a lot of money. Thank you so much for creating weekly trend. Please don’t go away.”
— Timothy S.
Verified subscriber · Using Weekly Trend for 11 months
3 Strategic Ways to Optimize Weekly Trend
Weekly Trend performs out of the box—but with smart tweaks, you can unlock even more consistency and upside.
Activate Weekly Trend when momentum matters most
Earnings season is historically one of the strongest periods for U.S. equities.
Large institutions often underestimate earnings, creating positive surprises and momentum when major companies report.
Weekly Trend can be switched on only during these high-probability windows.
How traders use it:
Automation ON during weeks with major earnings from large-cap names
Automation OFF during quiet weeks with few earnings catalysts
You stay exposed when momentum is statistically favorable —
and reduce exposure when conditions are less supportive.

Control participation using objective data
Some traders optimize Weekly Trend by trading only when probabilities improve.
Two rule-based methods are commonly used:
Streak timing:
Turn automation ON after a short losing streak and OFF after a streak of winners to align with probability resets.
Win-rate filter:
Trade when the rolling yearly win rate is below 60%.
Pause trading when it is above 60%.
Both approaches remove emotion and rely purely on statistics — not market opinions.

Stay active when markets rotate — not trend
Markets don’t trend all year.
Some traders combine Weekly Trend with Weekly Premium to stay engaged across different conditions.
How the combination works:
Weekly Trend stays ready to capture sharp market rallies
Weekly Premium collects premium when markets move sideways
This helps:
Reduce drawdowns
Smooth participation across market regimes
Stay positioned for sudden upside moves

FAQs
Everything you need to know about our Weekly Trend credit spread strategy before getting started.
Should I trade SPY or SPX?
We suggest trading SPY if your account size is between $2,000 and $15,000. For accounts with balances from $15,000 up to $100,000, trading SPX is usually a better fit.
To keep your risk manageable, start with a minimum risk per trade of $50 when trading SPY and $250 when trading SPX.
If you have a smaller account, SPY works especially well. It pairs nicely with the Tradier brokerage because they offer zero-commission trading, which helps you save on costs.
On the other hand, if you’re working with a larger account, SPX often makes more sense. For the best experience and lower fees, we recommend using Interactive Brokers.
How much should I allocate?
You can adjust this credit spread strategy easily based on the size of your account. This flexibility helps you take larger positions if you have more capital and feel comfortable with higher risk.
For example, if you prefer to keep the risk lower, we recommend starting with 2.5% risk per trade. On the other hand, if you have a moderate risk tolerance, you can choose 5% risk per trade.
Additionally, to grow your account faster, we suggest compounding your profits over time. This way, your gains can build on each other step by step.
Do you show real trades?
Yes, we display real trades and update the results table daily with the fills from our autotraders.
Commission costs differ by broker and cannot be included in the result tables.
The “$ Account Growth” column is based on a “% on account” allocation. This means that each trade’s risk is calculated based on your current margin at the time of entry. Larger accounts tend to grow faster than smaller ones because each win is built on a larger base. Therefore, the $ Account Growth with compounding varies from subscriber to subscriber.
Why does the S&P500 always go higher?
The S&P 500 is designed in a way that helps it grow steadily over time. Here are some simple reasons why this happens:
- Economic Growth – As time goes on, inflation, new inventions, and growing company profits all naturally push prices higher.
- Foreign Investment – Money from around the world keeps flowing into U.S. markets. As a result, this creates steady demand for stocks.
- Market Psychology – Public companies have strong reasons to meet or even beat Wall Street expectations, which supports rising stock prices.
- Buybacks & Reinvestment – Many companies use their profits to buy back their own shares or invest back into their business. Because of this, it helps keep the growth going.
- Survivorship Bias – Over time, weaker companies are removed from the index and replaced by stronger ones. This way, the S&P 500 always shows the leading companies in the market.
- ETF Inflows – Every year, more investors buy S&P 500 ETFs as a simple way to invest. Consequently, this constant buying creates more demand and supports prices over the long run.
Should I scale in?
Yes, scaling can help you lower risk and grow your profits steadily over the long term.
Here are two simple methods you can use:
Method 1: Gradual Risk Increase
First, start with half your usual risk per trade. For example, risk only 2.5% of your account on each trade. Then, when your account balance goes up by 20%, increase your risk to the normal level. If you face 3–4 losing trades in a row, go back to the smaller size. This way, you protect your capital and build confidence step by step.
Method 2: Enter After Losses
Another way is to place trades only after you see 3–4 losses in a row. Historically, this increases the chance of winning the next trade. As a result, you can limit drawdowns and boost your returns over time. This method makes your risk management more solid and less stressful.
How many trades do you have open at the same time?
We maintain a maximum of six open trades at once.
Can I trade weekly trend in a cash account?
Yes, you can trade credit spreads and debit spreads in a cash account with SPX weekly options. Since SPX settles in cash, you don’t have to worry about getting assigned shares. This feature makes it much easier and less stressful, especially if you’re just starting out.
Is there a risk of assignment at expiration?
No. You don’t need to worry about assignment risk because we plan every trade carefully to avoid it.
SPX weekly options are always cash-settled, which means you will never have to deal with taking delivery of the underlying asset.
Also, for SPY weekly options, we make sure to close all positions before they expire. This way, you avoid any unexpected assignments and keep everything simple and predictable.